
In the first two articles in this series, we built the foundation for how multifamily teams should approach physical climate risk. In Part 1, we established that climate risk now plays a role in portfolio allocation decisions. In Part 2, we explored how different hazards behave and why they affect performance in different ways.
At that point, most portfolios arrive at the same place. Exposure is visible, and the types of risk are understood. What remains unclear is where to focus next.
Climate risk analysis produces a long list of exposures across assets and markets, but it does not always produce a clear path forward. How should you leverage and prioritize available data?
Exposure Alone Falls Short
When you look at exposure at the asset level, nearly every property shows some level of risk. In our analysis of more than 3,400 investment-grade multifamily properties, every asset was exposed to at least one hazard, and most were exposed to several. That result reflects how widespread physical climate risk has become, but it does not help you decide where to act.
Exposure answers a binary question. It tells you whether risk exists. It does not tell you how much that risk matters.
This is where exposure lists lose their usefulness. They identify risk, but they do not help you decide what to do about it.
Bringing Value Into the Equation
Exposure needs context in order to move from identification to prioritization.
In Rent at Risk, we introduced that context by assigning each asset a consistent estimate of value using market-level inputs. This creates a comparable baseline across markets, allowing exposure to be evaluated in financial terms rather than as a simple yes-or-no condition.
Once value is introduced, exposure can be scaled. A larger asset exposed to multiple hazards carries more weight than a smaller asset with similar conditions. Exposure begins to reflect scale and not just presence.
At that point, another distinction becomes important. Not all hazards carry the same financial implications. A property exposed to hurricane risk faces a different set of potential outcomes than one exposed to temperature variability. To account for that, hazards can be grouped into tiers and weighted accordingly. Higher-impact risks are treated differently from more moderate ones, which creates a more realistic view of exposure without relying on complex modeling.
The result is a structured way to compare exposure across assets using a consistent financial lens.
How Prioritization Actually Happens
Now, prioritization becomes a question of alignment. If exposure follows the same pattern as asset value, risk is likely distributed as expected.
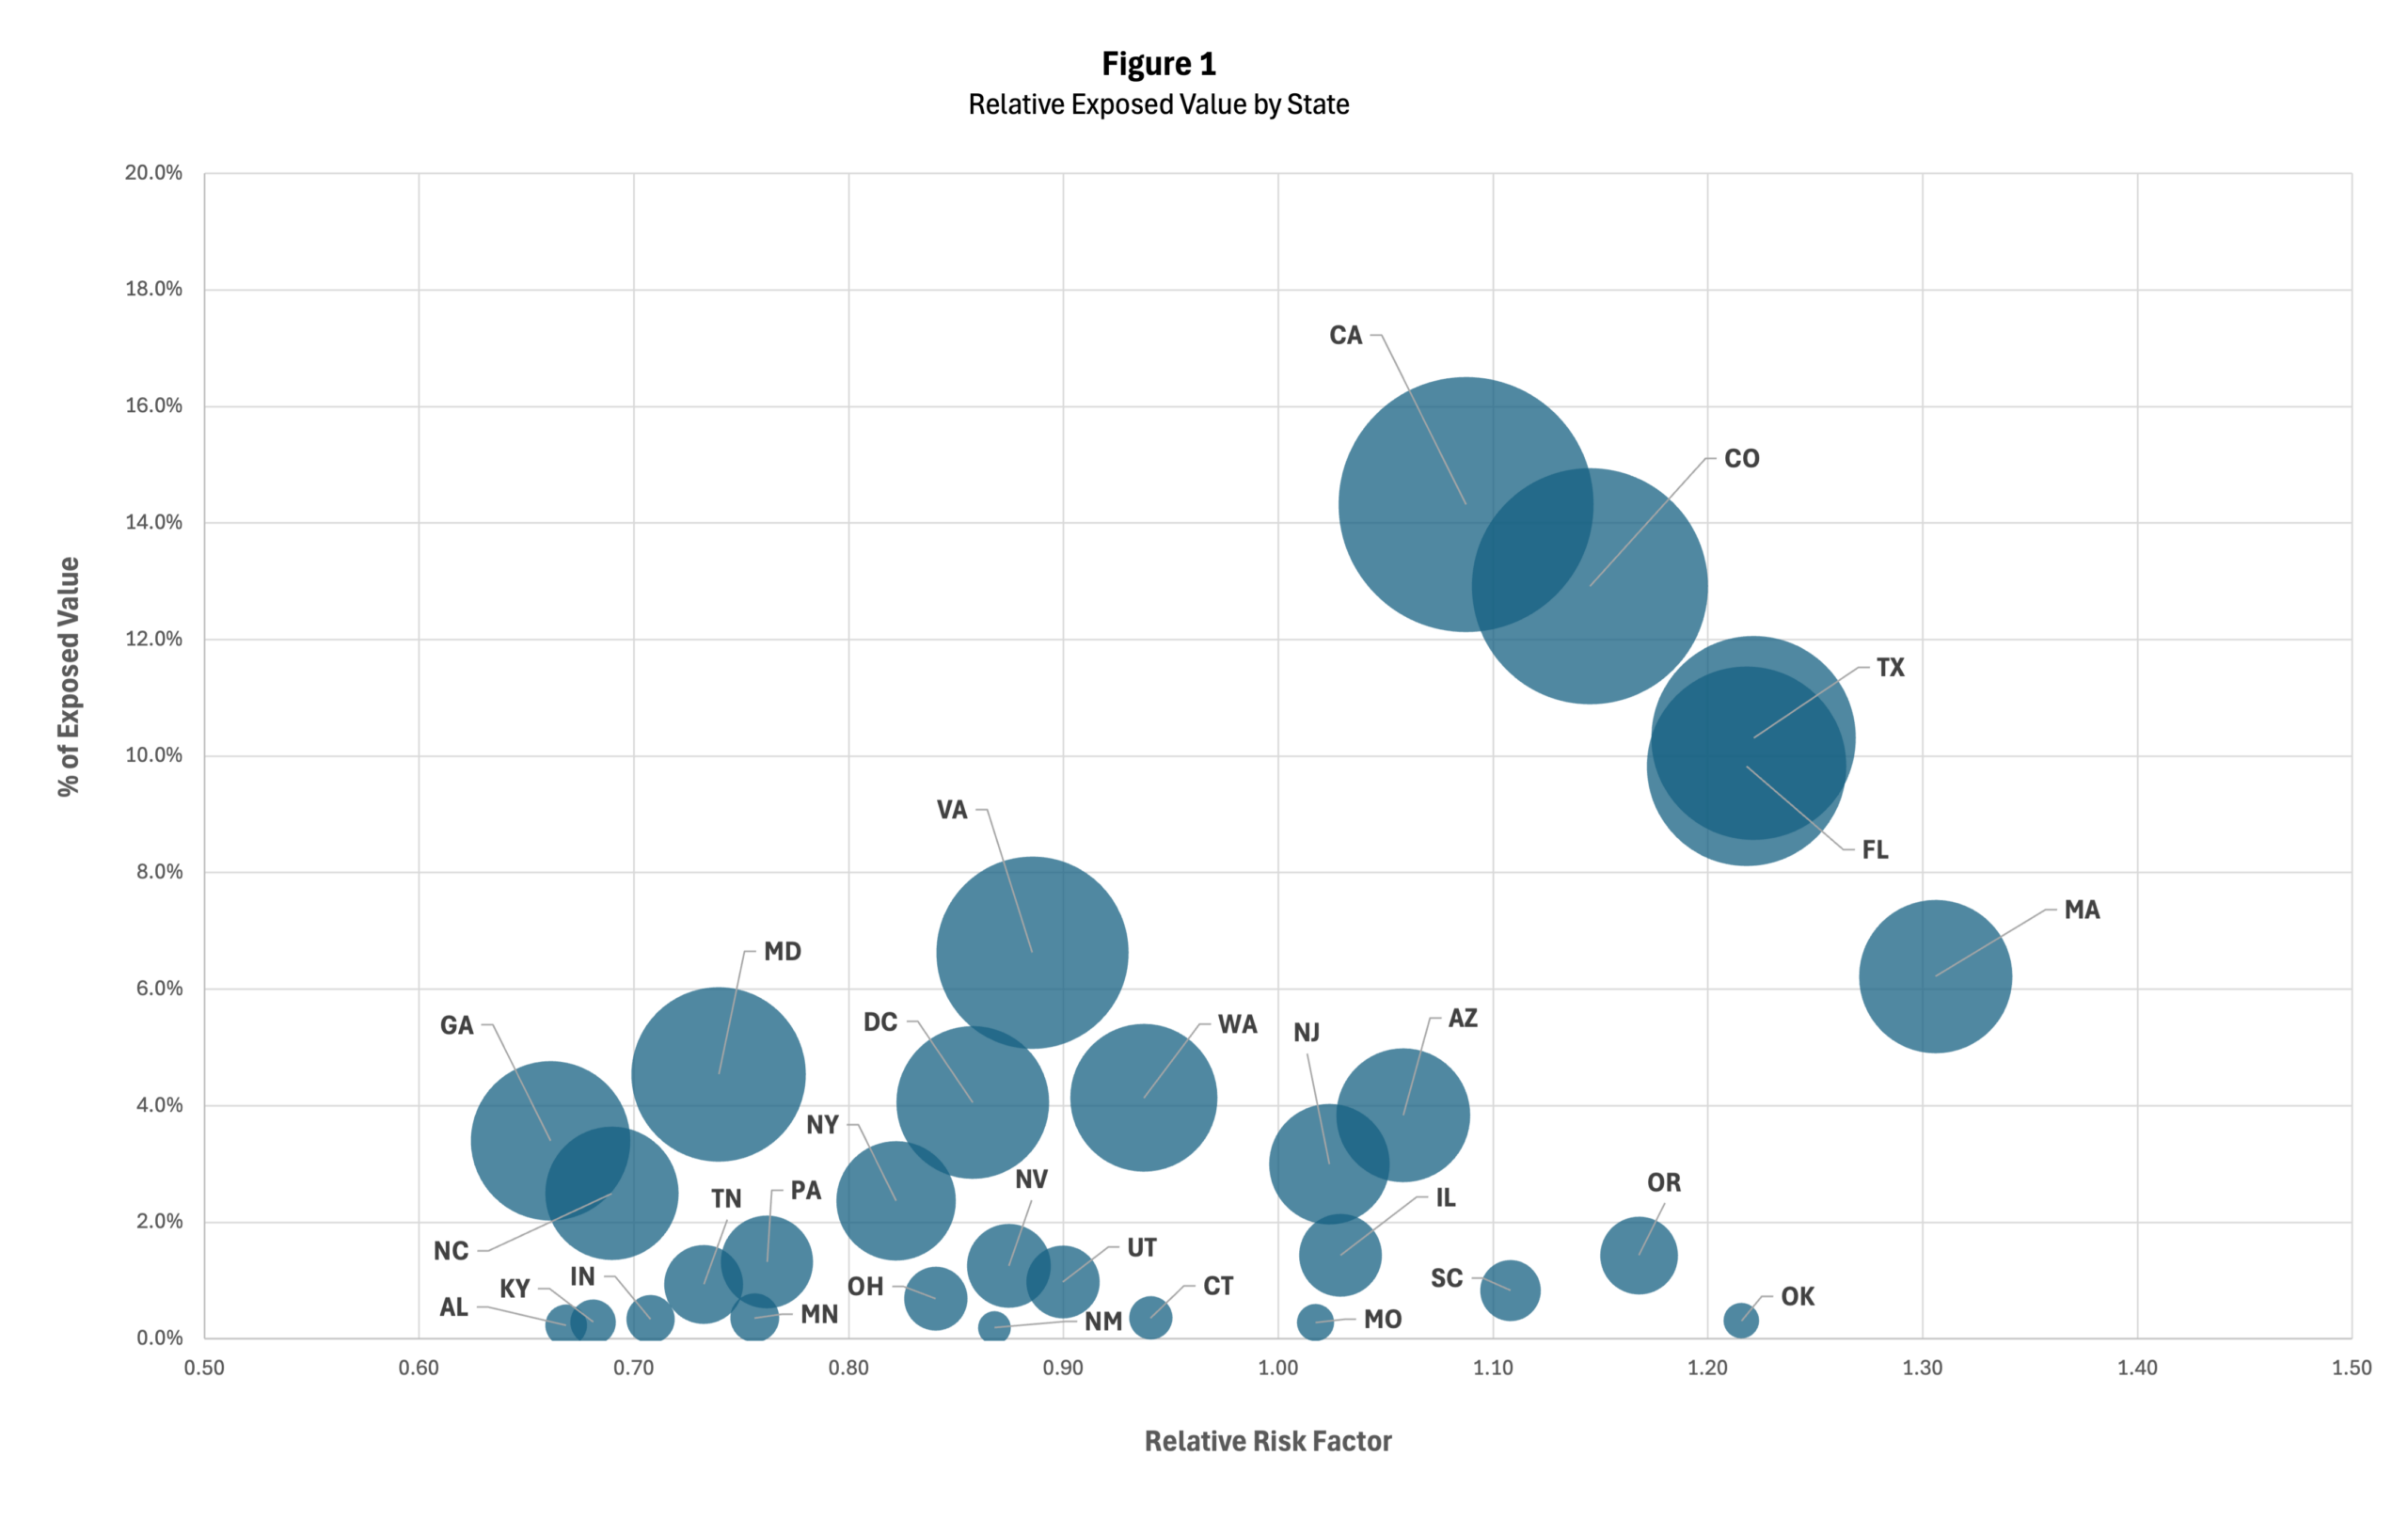
A market that represents a modest share of portfolio value may account for a much larger share of exposure. An individual asset may carry more risk than its size would suggest. These imbalances are what signal where attention should be directed.
What the Data Shows at Scale
When the approach above is applied across a large population of multifamily assets, certain patterns become clear.
Exposure tends to concentrate in specific markets where multiple hazards intersect with higher asset values. Some regions stand out because of the types of risks they face. Others emerge because of how capital is distributed within a portfolio. The result is not a short list of “safe” or “unsafe” markets.
That is the level of insight needed to move from awareness to action.
Application at the Portfolio-Level
The same logic applies within a single portfolio. When exposure is mapped against value, a small number of assets often emerge as priority candidates for deeper analysis. These properties tend to sit at the intersection of higher exposure and higher portfolio significance.
Now teams can focus their efforts. Instead of applying the same level of analysis across every asset, attention can be directed where it will have the most impact.
Rent at Risk: Assessing Physical Climate Risk in Multifamily Investments applies this framework across a large set of investment-grade properties, showing how exposure distributes and where it concentrates.



Subscribe To Our Blog Newsletter
Keep yourself ahead of the curve with the latest utility news, trends, & resources.
Editor's Picks

Conservice’s 2nd Annual 5K Brings Together More Than 500 Participants and Gives Back to Cache Valley
LOGAN, Utah — September 10, 2026 — Conservice celebrated its second annual 5K Fun Run on September 9, bringing employees, families, and community partners together for an afternoon of connection and giving back. More than 550 people registered for this…

The How-to Guide for Reducing CAM Charges and Shared Space Costs
TL;DR When investigating where to reduce CAM charges and multifamily common-area costs, shared utility expenses might be the place to start. A higher bill doesn’t automatically signal waste, so it’s important to compare cost and consumption before deciding where to…

Installing EV Charging Stations: A Guide for Multifamily Property Owners
Have there always been this many electric vehicles on the road? It looks like the silent hum of an EV has become a roar, as Electric vehicles take the United States by storm. With the rise of EVs, comes the…

Policy Watch: Compliance & Building Readiness with Brett Kraus and Michelle Winters
Policy Watch: Compliance & Building Readiness with | RSS.com In this episode of Utility Wisdom, Michelle Winters, Vice President of Sustainability Sales at Conservice, sits down with Brett Kraus, Senior Legal Counsel, and Katie Piel, Sustainability Manager, to break down…
Conservice Earns 15th Appearance on Inc. 5000
RIVER HEIGHTS, Utah, August 14, 2026 – Conservice, the nation’s leading utility management provider, has been named to the 2026 Inc. 5000, marking the company’s 15th appearance on the annual list of America’s fastest-growing private companies. The recognition adds another…

5 Signs Your Telecom Strategy Needs An Update
Telecom has a funny way of becoming someone’s problem. A resident can’t get connected, so they call the onsite property team. A provider needs an answer, so someone digs through an old agreement. A renewal date appears on the calendar,…

How to Streamline Invoice Processing & Auditing
Utility bills have a lot to say. They can tell you where costs are climbing and where usage looks unusual. They can point to a provider error before it hits your bottom line. And across hundreds or thousands of accounts,…

Ask An Expert with Sustainability Expert, Sandra Closson
Meet Sandra Closson Some people see spreadsheets full of utility data. Sandra sees a story about how a building operates and where it can improve. With nearly three decades of professional experience and 17 years in sustainability, Sandra has built…

The Next Chapter of Single Family Operations
At some point “more” stops being the answer. The single family industry has spent the last decade defining success as growth. Build new properties, acquire existing properties, attract institutional investment, repeat. Portfolios grew from hundreds of homes to thousands. “More”…

RUBS Utility Billing vs. Submetering: A Decision Guide
RUBS Utility Billing vs. Submetering A Decision Gu | RSS.com TL;DR: Not every property gets to choose between RUBS and submetering – your building, budget, and state regulations all play a role. RUBS (Ratio Utility Billing System) is faster and…
Experience Effortless Utility Management and Cost Savings
Connect with us today to discover how our solutions can ease tenant billback, streamline utility management, and reduce your costs and energy usage. Make your utility management smarter and more efficient with Conservice!